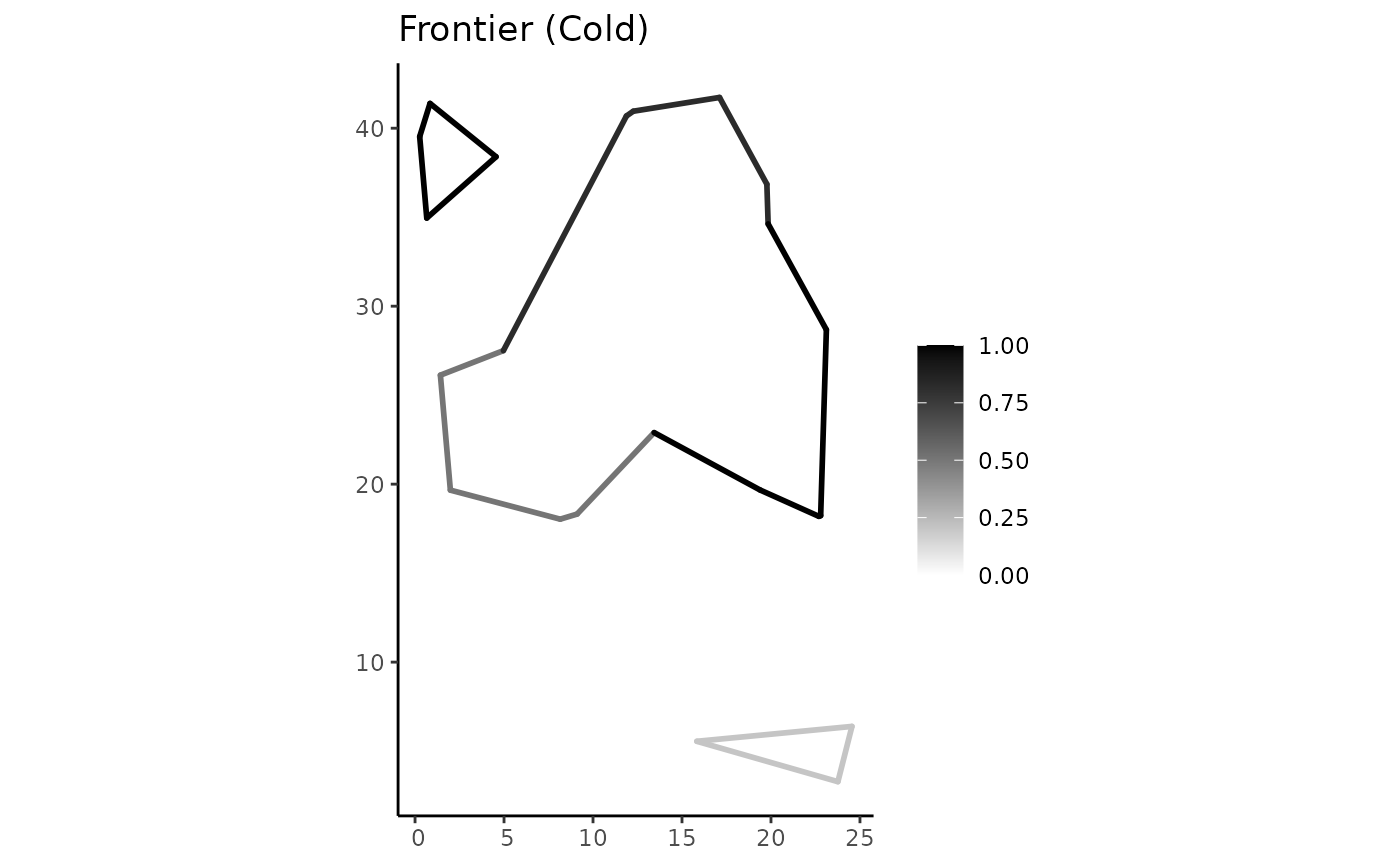
spa_contour() extracts the frontier (i.e., linear boundary) of a plateau region object by maintaining its membership degrees.
Value
A pline object that represents the contour (i.e. frontier) of a plateau region object given as input.
Details
The spa_contour() function implements the definition of fuzzy frontier of a fuzzy region object in the context of Spatial Plateau Algebra.
The fuzzy frontier of a fuzzy region object A collects all single points of A, preserving its membership degrees, that are not in the interior of its support.
Note that fuzzy frontier is different from fuzzy boundary (see spa_boundary()).
Examples
library(tibble)
library(sf)
library(ggplot2)

# defining two different types of membership functions
trap_mf <- function(a, b, c, d) {
  function(x) {
    pmax(pmin((x - a)/(b - a), 1, (d - x)/(d - c), na.rm = TRUE), 0)
  }
}

set.seed(7)
tbl = tibble(x = runif(20, min = 0, max = 30),
             y = runif(20, min = 0, max = 50),
             z = runif(20, min = 0, max = 100))
classes <- c("cold", "hot")
cold_mf <- trap_mf(0, 10, 20, 35)
hot_mf <- trap_mf(20, 50, 100, 100)

# Getting the convex hull on the points to clip plateau region objects during their constructions
pts <- st_as_sf(tbl, coords = c(1, 2))
ch <- st_convex_hull(do.call(c, st_geometry(pts)))

# Using the standard fuzzification policy based on fuzzy sets
pregions <- spa_creator(tbl, classes = classes, mfs = c(cold_mf, hot_mf), base_poly = ch)
pregions
#> # A tibble: 2 × 2
#>   class pgeometry
#>   <chr> <list>
#> 1 cold  <pregion>
#> 2 hot   <pregion>
# \dontrun{
plot(pregions$pgeometry[[1]]) + ggtitle("Cold")

plot(pregions$pgeometry[[2]]) + ggtitle("Hot")

# }
# capturing and showing the frontier of each pgeometry object previously created
cold_contour <- spa_contour(pregions$pgeometry[[1]])
hot_contour <- spa_contour(pregions$pgeometry[[2]])
# \dontrun{
plot(cold_contour) + ggtitle("Frontier (Cold)")

plot(hot_contour) + ggtitle("Frontier (Hot)")

# }
# }